lambda dna Search Results


90
ATCC phage lambda dna
Phage Lambda Dna, supplied by ATCC, used in various techniques. Bioz Stars score: 90/100, based on 1 PubMed citations. ZERO BIAS - scores, article reviews, protocol conditions and more
https://www.bioz.com/result/phage lambda dna/product/ATCC
Average 90 stars, based on 1 article reviews
phage lambda dna - by Bioz Stars, 2026-06
90/100 stars
  Buy from Supplier

96
New England Biolabs lambda dna
Lambda Dna, supplied by New England Biolabs, used in various techniques. Bioz Stars score: 96/100, based on 1 PubMed citations. ZERO BIAS - scores, article reviews, protocol conditions and more
https://www.bioz.com/result/lambda dna/product/New England Biolabs
Average 96 stars, based on 1 article reviews
lambda dna - by Bioz Stars, 2026-06
96/100 stars
  Buy from Supplier

96
New England Biolabs kb lambda phage dna
Kb Lambda Phage Dna, supplied by New England Biolabs, used in various techniques. Bioz Stars score: 96/100, based on 1 PubMed citations. ZERO BIAS - scores, article reviews, protocol conditions and more
https://www.bioz.com/result/kb lambda phage dna/product/New England Biolabs
Average 96 stars, based on 1 article reviews
kb lambda phage dna - by Bioz Stars, 2026-06
96/100 stars
  Buy from Supplier

94
New England Biolabs lambda dna hindiii digest ladder
Lambda Dna Hindiii Digest Ladder, supplied by New England Biolabs, used in various techniques. Bioz Stars score: 94/100, based on 1 PubMed citations. ZERO BIAS - scores, article reviews, protocol conditions and more
https://www.bioz.com/result/lambda dna hindiii digest ladder/product/New England Biolabs
Average 94 stars, based on 1 article reviews
lambda dna hindiii digest ladder - by Bioz Stars, 2026-06
94/100 stars
  Buy from Supplier

94
Jena Bioscience λ dna
λ Dna, supplied by Jena Bioscience, used in various techniques. Bioz Stars score: 94/100, based on 1 PubMed citations. ZERO BIAS - scores, article reviews, protocol conditions and more
https://www.bioz.com/result/λ dna/product/Jena Bioscience
Average 94 stars, based on 1 article reviews
λ dna - by Bioz Stars, 2026-06
94/100 stars
  Buy from Supplier

91
OriGene hek293t cells
a, Top, schematic of MMEJ reporter containing 5′-streptavidin-biotin linkages. Middle, internal termini of left and right MMEJ reporter DNA constructs. Bottom, schematic of MMEJ reporter assay. b−f, Bar plots showing relative GFP frequencies following cotransfection of left and right MMEJ reporter DNA constructs, with immunoblots showing abundance of protein shown in c and e−g. b, GFP+ frequencies are shown relative to nontargeting siRNA (siControl = 1) in wildtype <t>HEK293T</t> cells; n = 3; P = 0.01. c, GFP+ frequencies relative to POLλ+/+ 293T cells (POLλ+/+ = 1). n = 3, P = 0.01. d, Same as in b in POLλ−/− 293T cells. n = 3, P = 0.03. e, GFP+ frequencies relative to nontargeting siRNA (siControl = 1). n = 3, P = 0.04. f, GFP+ frequencies relative to nontargeting siRNA (siControl = 1) in XRCC4−/− 293T cells. Data represent means. n = 2, P = 0.04. g, MMEJ GFP reporter assay. Schematic of GFP reporter assay (top). Bar plot of percentage of GFP cells following transient expression of I-SceI and cotransfection of either Polλ siRNA or Control siRNA. n = 2, P = 0.04. h, Bar plots showing percentage of colonies relative to control after siRNA transfection in DLD1 BRCA2−/− or DLD1 Parental cells (top), in MDA-MB-436 BRCA1 mut or MDA-MB-231 cells (bottom). Percentage of colonies are normalized to nontargeting siRNA (siControl = 100). n = 1. Colony images are on the right. In b and c−g, GFP+ frequencies are normalized to transfection efficiency. Data represent means. ‘n’ denotes number of independent experiments with triplicates for each condition, ± s.e.m. *P < 0.05, **P < 0.01, ***P < 0.001. Statistical significance was measured from two-sample t-test and P values are indicated.
Hek293t Cells, supplied by OriGene, used in various techniques. Bioz Stars score: 91/100, based on 1 PubMed citations. ZERO BIAS - scores, article reviews, protocol conditions and more
https://www.bioz.com/result/hek293t cells/product/OriGene
Average 91 stars, based on 1 article reviews
hek293t cells - by Bioz Stars, 2026-06
91/100 stars
  Buy from Supplier

91
Novus Biologicals dna polλ rabbit polyclonal antibody
a, Top, schematic of MMEJ reporter containing 5′-streptavidin-biotin linkages. Middle, internal termini of left and right MMEJ reporter DNA constructs. Bottom, schematic of MMEJ reporter assay. b−f, Bar plots showing relative GFP frequencies following cotransfection of left and right MMEJ reporter DNA constructs, with immunoblots showing abundance of protein shown in c and e−g. b, GFP+ frequencies are shown relative to nontargeting siRNA (siControl = 1) in wildtype <t>HEK293T</t> cells; n = 3; P = 0.01. c, GFP+ frequencies relative to POLλ+/+ 293T cells (POLλ+/+ = 1). n = 3, P = 0.01. d, Same as in b in POLλ−/− 293T cells. n = 3, P = 0.03. e, GFP+ frequencies relative to nontargeting siRNA (siControl = 1). n = 3, P = 0.04. f, GFP+ frequencies relative to nontargeting siRNA (siControl = 1) in XRCC4−/− 293T cells. Data represent means. n = 2, P = 0.04. g, MMEJ GFP reporter assay. Schematic of GFP reporter assay (top). Bar plot of percentage of GFP cells following transient expression of I-SceI and cotransfection of either Polλ siRNA or Control siRNA. n = 2, P = 0.04. h, Bar plots showing percentage of colonies relative to control after siRNA transfection in DLD1 BRCA2−/− or DLD1 Parental cells (top), in MDA-MB-436 BRCA1 mut or MDA-MB-231 cells (bottom). Percentage of colonies are normalized to nontargeting siRNA (siControl = 100). n = 1. Colony images are on the right. In b and c−g, GFP+ frequencies are normalized to transfection efficiency. Data represent means. ‘n’ denotes number of independent experiments with triplicates for each condition, ± s.e.m. *P < 0.05, **P < 0.01, ***P < 0.001. Statistical significance was measured from two-sample t-test and P values are indicated.
Dna Polλ Rabbit Polyclonal Antibody, supplied by Novus Biologicals, used in various techniques. Bioz Stars score: 91/100, based on 1 PubMed citations. ZERO BIAS - scores, article reviews, protocol conditions and more
https://www.bioz.com/result/dna polλ rabbit polyclonal antibody/product/Novus Biologicals
Average 91 stars, based on 1 article reviews
dna polλ rabbit polyclonal antibody - by Bioz Stars, 2026-06
91/100 stars
  Buy from Supplier

93
Novus Biologicals anti human polλ antibody
a, Top, schematic of MMEJ reporter containing 5′-streptavidin-biotin linkages. Middle, internal termini of left and right MMEJ reporter DNA constructs. Bottom, schematic of MMEJ reporter assay. b−f, Bar plots showing relative GFP frequencies following cotransfection of left and right MMEJ reporter DNA constructs, with immunoblots showing abundance of protein shown in c and e−g. b, GFP+ frequencies are shown relative to nontargeting siRNA (siControl = 1) in wildtype <t>HEK293T</t> cells; n = 3; P = 0.01. c, GFP+ frequencies relative to POLλ+/+ 293T cells (POLλ+/+ = 1). n = 3, P = 0.01. d, Same as in b in POLλ−/− 293T cells. n = 3, P = 0.03. e, GFP+ frequencies relative to nontargeting siRNA (siControl = 1). n = 3, P = 0.04. f, GFP+ frequencies relative to nontargeting siRNA (siControl = 1) in XRCC4−/− 293T cells. Data represent means. n = 2, P = 0.04. g, MMEJ GFP reporter assay. Schematic of GFP reporter assay (top). Bar plot of percentage of GFP cells following transient expression of I-SceI and cotransfection of either Polλ siRNA or Control siRNA. n = 2, P = 0.04. h, Bar plots showing percentage of colonies relative to control after siRNA transfection in DLD1 BRCA2−/− or DLD1 Parental cells (top), in MDA-MB-436 BRCA1 mut or MDA-MB-231 cells (bottom). Percentage of colonies are normalized to nontargeting siRNA (siControl = 100). n = 1. Colony images are on the right. In b and c−g, GFP+ frequencies are normalized to transfection efficiency. Data represent means. ‘n’ denotes number of independent experiments with triplicates for each condition, ± s.e.m. *P < 0.05, **P < 0.01, ***P < 0.001. Statistical significance was measured from two-sample t-test and P values are indicated.
Anti Human Polλ Antibody, supplied by Novus Biologicals, used in various techniques. Bioz Stars score: 93/100, based on 1 PubMed citations. ZERO BIAS - scores, article reviews, protocol conditions and more
https://www.bioz.com/result/anti human polλ antibody/product/Novus Biologicals
Average 93 stars, based on 1 article reviews
anti human polλ antibody - by Bioz Stars, 2026-06
93/100 stars
  Buy from Supplier

93
New England Biolabs lambda monocut ladder
(A) Layout of rat HoxA locus in the rn6 genome assembly. The rn6 genome includes an erroneous duplication at the HoxA locus between gaps in the assembly. The SynHoxA assemblon sequence is based on bringing together the two ‘separate’ RnHoxA segments. The sequence was segmented into 28 ∼5kb PCR amplicons with terminal homology of ∼200bp to adjacent amplicons. Conservation to the mouse genome is depicted using the multiz track from the UCSC genome browser. (B) Schematic depicting the assembly workflow for the 134kb SynHoxA assemblon. BACs containing Rat HoxA were used as PCR template to generate 28 segments tiling the entire HoxA locus. These segments were co-transformed into yeast with appropriate linkers and assembly vector to build two ∼65kb half assemblons into centromeric yeast-bacteria shuttle vectors. These half assemblons are recovered to bacteria and amplified. Full 134kb assemblon was built from half assemblons after releasing them from the vector using terminal restriction enzymes ( AsiSI ) and transforming into yeast. Full assemblon was then recovered from yeast into bacteria for amplification and verification. (C) Agarose gel of the 28 PCR amplicons that tile the 134kb SynHoxA assemblon. (D) Strategy to PCR-screen yeast colonies derived from assembly experiments. Primers (red arrows) span assembly junctions and test presence/absence of amplicons in many yeast colonies. Reproduced from ref with permission from authors. (E) Agarose gel showing one yeast colony carrying the full 134kb SynHoxA assemblon verified manually for the presence of all assembly junctions, using the strategy outlined in panel D. (F) Half and Full 134kb SynHoxA assemblon BACs purified from E.coli were digested with PvuI and separated using field inversion gel electrophoresis (FIGE). <t>Lambda</t> <t>monocut</t> ladder sizes are indicated in kb. Band sizes correspond to expected fragments.
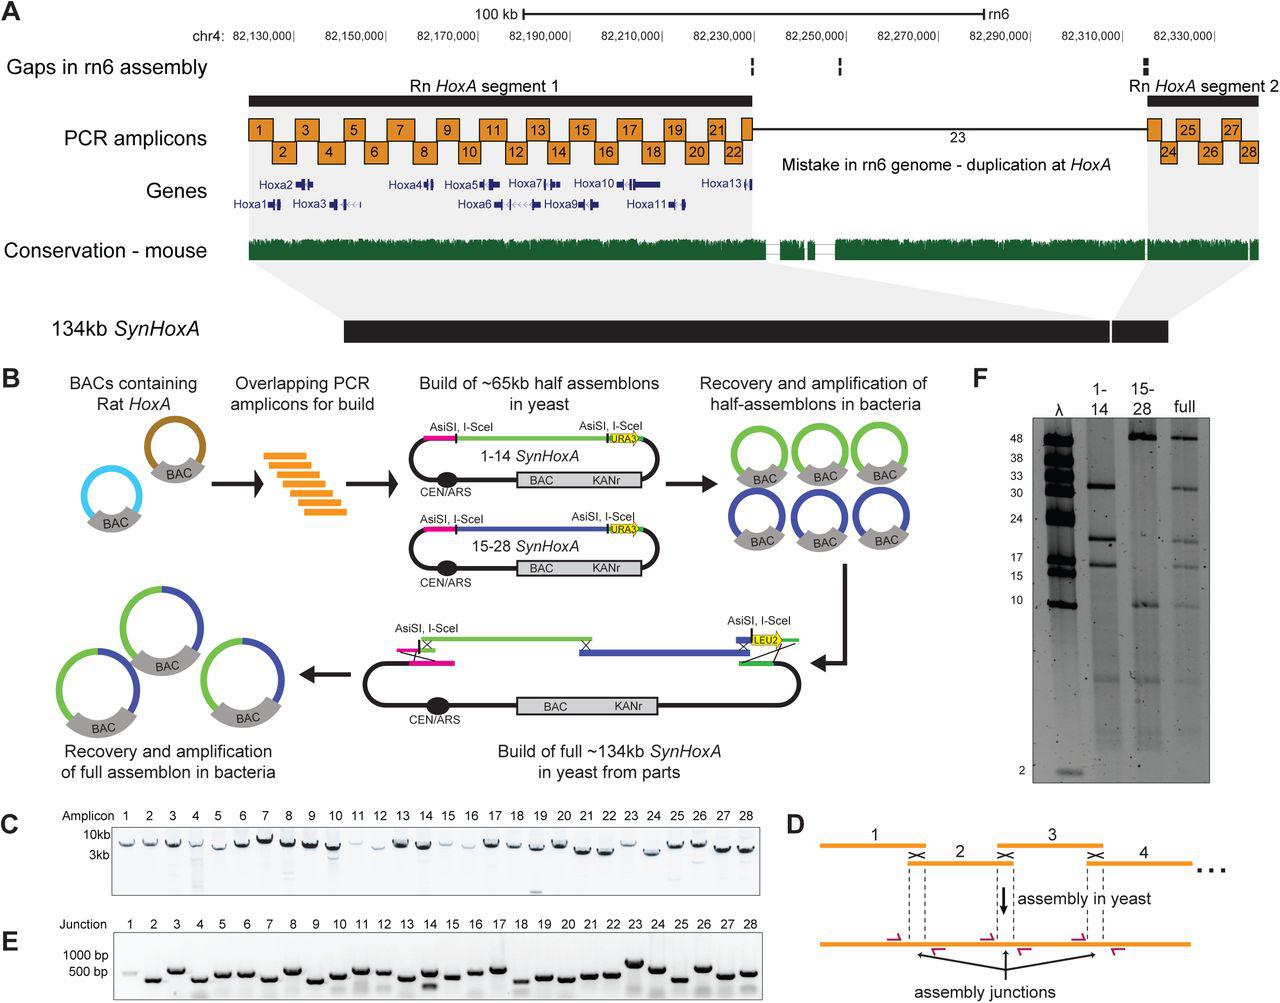
Lambda Monocut Ladder, supplied by New England Biolabs, used in various techniques. Bioz Stars score: 93/100, based on 1 PubMed citations. ZERO BIAS - scores, article reviews, protocol conditions and more
https://www.bioz.com/result/lambda monocut ladder/product/New England Biolabs
Average 93 stars, based on 1 article reviews
lambda monocut ladder - by Bioz Stars, 2026-06
93/100 stars
  Buy from Supplier

92
New England Biolabs bacteriophage lambda dna bst eii digest
Restriction patterns from AseI digests of M. avium isolates resolved by PFGE. Lanes: 1 and 6, bacteriophage <t>lambda</t> <t>DNA</t> concatemers (sizes [in kilobases] are indicated on the left); 2, isolate 100A8; 3 and 4, pattern P7 (isolates 100A28 and 100A32, respectively); 5, isolate 100A25; 7 to 11, five sequential isolates from one patient, respectively (pattern P1); 12 to 15, four isolates from two patients, respectively (pattern P2).
Bacteriophage Lambda Dna Bst Eii Digest, supplied by New England Biolabs, used in various techniques. Bioz Stars score: 92/100, based on 1 PubMed citations. ZERO BIAS - scores, article reviews, protocol conditions and more
https://www.bioz.com/result/bacteriophage lambda dna bst eii digest/product/New England Biolabs
Average 92 stars, based on 1 article reviews
bacteriophage lambda dna bst eii digest - by Bioz Stars, 2026-06
92/100 stars
  Buy from Supplier

93
New England Biolabs lambda dna mono cut mix
Restriction patterns from AseI digests of M. avium isolates resolved by PFGE. Lanes: 1 and 6, bacteriophage <t>lambda</t> <t>DNA</t> concatemers (sizes [in kilobases] are indicated on the left); 2, isolate 100A8; 3 and 4, pattern P7 (isolates 100A28 and 100A32, respectively); 5, isolate 100A25; 7 to 11, five sequential isolates from one patient, respectively (pattern P1); 12 to 15, four isolates from two patients, respectively (pattern P2).
Lambda Dna Mono Cut Mix, supplied by New England Biolabs, used in various techniques. Bioz Stars score: 93/100, based on 1 PubMed citations. ZERO BIAS - scores, article reviews, protocol conditions and more
https://www.bioz.com/result/lambda dna mono cut mix/product/New England Biolabs
Average 93 stars, based on 1 article reviews
lambda dna mono cut mix - by Bioz Stars, 2026-06
93/100 stars
  Buy from Supplier

Image Search Results


a, Top, schematic of MMEJ reporter containing 5′-streptavidin-biotin linkages. Middle, internal termini of left and right MMEJ reporter DNA constructs. Bottom, schematic of MMEJ reporter assay. b−f, Bar plots showing relative GFP frequencies following cotransfection of left and right MMEJ reporter DNA constructs, with immunoblots showing abundance of protein shown in c and e−g. b, GFP+ frequencies are shown relative to nontargeting siRNA (siControl = 1) in wildtype HEK293T cells; n = 3; P = 0.01. c, GFP+ frequencies relative to POLλ+/+ 293T cells (POLλ+/+ = 1). n = 3, P = 0.01. d, Same as in b in POLλ−/− 293T cells. n = 3, P = 0.03. e, GFP+ frequencies relative to nontargeting siRNA (siControl = 1). n = 3, P = 0.04. f, GFP+ frequencies relative to nontargeting siRNA (siControl = 1) in XRCC4−/− 293T cells. Data represent means. n = 2, P = 0.04. g, MMEJ GFP reporter assay. Schematic of GFP reporter assay (top). Bar plot of percentage of GFP cells following transient expression of I-SceI and cotransfection of either Polλ siRNA or Control siRNA. n = 2, P = 0.04. h, Bar plots showing percentage of colonies relative to control after siRNA transfection in DLD1 BRCA2−/− or DLD1 Parental cells (top), in MDA-MB-436 BRCA1 mut or MDA-MB-231 cells (bottom). Percentage of colonies are normalized to nontargeting siRNA (siControl = 100). n = 1. Colony images are on the right. In b and c−g, GFP+ frequencies are normalized to transfection efficiency. Data represent means. ‘n’ denotes number of independent experiments with triplicates for each condition, ± s.e.m. *P < 0.05, **P < 0.01, ***P < 0.001. Statistical significance was measured from two-sample t-test and P values are indicated.

Journal: Nature structural & molecular biology

Article Title: Polλ promotes microhomology-mediated end-joining

doi: 10.1038/s41594-022-00895-4

Figure Lengend Snippet: a, Top, schematic of MMEJ reporter containing 5′-streptavidin-biotin linkages. Middle, internal termini of left and right MMEJ reporter DNA constructs. Bottom, schematic of MMEJ reporter assay. b−f, Bar plots showing relative GFP frequencies following cotransfection of left and right MMEJ reporter DNA constructs, with immunoblots showing abundance of protein shown in c and e−g. b, GFP+ frequencies are shown relative to nontargeting siRNA (siControl = 1) in wildtype HEK293T cells; n = 3; P = 0.01. c, GFP+ frequencies relative to POLλ+/+ 293T cells (POLλ+/+ = 1). n = 3, P = 0.01. d, Same as in b in POLλ−/− 293T cells. n = 3, P = 0.03. e, GFP+ frequencies relative to nontargeting siRNA (siControl = 1). n = 3, P = 0.04. f, GFP+ frequencies relative to nontargeting siRNA (siControl = 1) in XRCC4−/− 293T cells. Data represent means. n = 2, P = 0.04. g, MMEJ GFP reporter assay. Schematic of GFP reporter assay (top). Bar plot of percentage of GFP cells following transient expression of I-SceI and cotransfection of either Polλ siRNA or Control siRNA. n = 2, P = 0.04. h, Bar plots showing percentage of colonies relative to control after siRNA transfection in DLD1 BRCA2−/− or DLD1 Parental cells (top), in MDA-MB-436 BRCA1 mut or MDA-MB-231 cells (bottom). Percentage of colonies are normalized to nontargeting siRNA (siControl = 100). n = 1. Colony images are on the right. In b and c−g, GFP+ frequencies are normalized to transfection efficiency. Data represent means. ‘n’ denotes number of independent experiments with triplicates for each condition, ± s.e.m. *P < 0.05, **P < 0.01, ***P < 0.001. Statistical significance was measured from two-sample t-test and P values are indicated.

Article Snippet: For overexpression of Polλ WT, 1 × 10 4 HEK293T cells were plated and, after 24 h, 200 ng either Polλ WT-Myc-DDK-tagged (Origene catalog no. RC230157) or Empty vector control plasmid was transfected using lipofectamine 2000.

Techniques: Construct, Reporter Assay, Cotransfection, Western Blot, Expressing, Control, Transfection

a. RT qPCR analysis of Polθ expression. mRNA levels were corrected with internal control for Actin in siRNA-treated cells used in Fig. 3b, ​,dd as well as normalized to non-targeting siRNA (siControl = 1). Data represent mean. n = 1 experiment with triplicate for each condition ±SEM. b. gRNA sequence used to generate POLL−/− HEK293T cells via CRISPR-Cas9 engineering. Schematic representation of three isoforms of human Polλ with protein domains as well as location of gRNA sequence (red) is indicated. The genome sequence flanking the gRNA sequence (red) is shown in gray. POLL −/− clone # T2 was generated by CRISPR-Cas9 engineering and carries 7 bp deletion in both alleles. Sequence of the region harboring the 7 bp deletion is indicated in blue. c. Bar plot showing relative GFP following overexpression of indicated plasmids and co- transfection of left and right MMEJ reporter DNA constructs in HEK293T cells. GFP+ frequencies are normalized to transfection efficiency. Data represent mean. n = 1 experiment with triplicates for each condition, +/− s.e.m. Bottom panel: Immunoblot showing abundance of protein. d. gRNA sequence used to generate LIG4 −/− HEK293T cells (top) and XRCC4 −/− HEK293T cells (bottom) via CRISPR-Cas9 engineering. Schematic representation of human Lig4 (top) and Xrcc4 (bottom) with protein domains as well as location of gRNA sequence is indicated (red). e. Same as in Fig. 3f in XRCC4−/− HCT116 cells. Data represent mean. n = 1 experiment with triplicate for each condition, +/− s.e.m. Bottom panel: Immunoblot showing abundance of protein. f. Western blot of Polλ (top) and Gapdh (bottom) following transfection of either Polλ siRNA or siControl in DLD1 BRCA2+/+ (left) and DLD1 BRCA2 −/− cells (right).

Journal: Nature structural & molecular biology

Article Title: Polλ promotes microhomology-mediated end-joining

doi: 10.1038/s41594-022-00895-4

Figure Lengend Snippet: a. RT qPCR analysis of Polθ expression. mRNA levels were corrected with internal control for Actin in siRNA-treated cells used in Fig. 3b, ​,dd as well as normalized to non-targeting siRNA (siControl = 1). Data represent mean. n = 1 experiment with triplicate for each condition ±SEM. b. gRNA sequence used to generate POLL−/− HEK293T cells via CRISPR-Cas9 engineering. Schematic representation of three isoforms of human Polλ with protein domains as well as location of gRNA sequence (red) is indicated. The genome sequence flanking the gRNA sequence (red) is shown in gray. POLL −/− clone # T2 was generated by CRISPR-Cas9 engineering and carries 7 bp deletion in both alleles. Sequence of the region harboring the 7 bp deletion is indicated in blue. c. Bar plot showing relative GFP following overexpression of indicated plasmids and co- transfection of left and right MMEJ reporter DNA constructs in HEK293T cells. GFP+ frequencies are normalized to transfection efficiency. Data represent mean. n = 1 experiment with triplicates for each condition, +/− s.e.m. Bottom panel: Immunoblot showing abundance of protein. d. gRNA sequence used to generate LIG4 −/− HEK293T cells (top) and XRCC4 −/− HEK293T cells (bottom) via CRISPR-Cas9 engineering. Schematic representation of human Lig4 (top) and Xrcc4 (bottom) with protein domains as well as location of gRNA sequence is indicated (red). e. Same as in Fig. 3f in XRCC4−/− HCT116 cells. Data represent mean. n = 1 experiment with triplicate for each condition, +/− s.e.m. Bottom panel: Immunoblot showing abundance of protein. f. Western blot of Polλ (top) and Gapdh (bottom) following transfection of either Polλ siRNA or siControl in DLD1 BRCA2+/+ (left) and DLD1 BRCA2 −/− cells (right).

Article Snippet: For overexpression of Polλ WT, 1 × 10 4 HEK293T cells were plated and, after 24 h, 200 ng either Polλ WT-Myc-DDK-tagged (Origene catalog no. RC230157) or Empty vector control plasmid was transfected using lipofectamine 2000.

Techniques: Quantitative RT-PCR, Expressing, Control, Sequencing, CRISPR, Generated, Over Expression, Cotransfection, Construct, Transfection, Western Blot

(A) Layout of rat HoxA locus in the rn6 genome assembly. The rn6 genome includes an erroneous duplication at the HoxA locus between gaps in the assembly. The SynHoxA assemblon sequence is based on bringing together the two ‘separate’ RnHoxA segments. The sequence was segmented into 28 ∼5kb PCR amplicons with terminal homology of ∼200bp to adjacent amplicons. Conservation to the mouse genome is depicted using the multiz track from the UCSC genome browser. (B) Schematic depicting the assembly workflow for the 134kb SynHoxA assemblon. BACs containing Rat HoxA were used as PCR template to generate 28 segments tiling the entire HoxA locus. These segments were co-transformed into yeast with appropriate linkers and assembly vector to build two ∼65kb half assemblons into centromeric yeast-bacteria shuttle vectors. These half assemblons are recovered to bacteria and amplified. Full 134kb assemblon was built from half assemblons after releasing them from the vector using terminal restriction enzymes ( AsiSI ) and transforming into yeast. Full assemblon was then recovered from yeast into bacteria for amplification and verification. (C) Agarose gel of the 28 PCR amplicons that tile the 134kb SynHoxA assemblon. (D) Strategy to PCR-screen yeast colonies derived from assembly experiments. Primers (red arrows) span assembly junctions and test presence/absence of amplicons in many yeast colonies. Reproduced from ref with permission from authors. (E) Agarose gel showing one yeast colony carrying the full 134kb SynHoxA assemblon verified manually for the presence of all assembly junctions, using the strategy outlined in panel D. (F) Half and Full 134kb SynHoxA assemblon BACs purified from E.coli were digested with PvuI and separated using field inversion gel electrophoresis (FIGE). Lambda monocut ladder sizes are indicated in kb. Band sizes correspond to expected fragments.

Journal: bioRxiv

Article Title: Synthetic genomic reconstitution reveals principles of mammalian Hox cluster regulation

doi: 10.1101/2021.07.07.451065

Figure Lengend Snippet: (A) Layout of rat HoxA locus in the rn6 genome assembly. The rn6 genome includes an erroneous duplication at the HoxA locus between gaps in the assembly. The SynHoxA assemblon sequence is based on bringing together the two ‘separate’ RnHoxA segments. The sequence was segmented into 28 ∼5kb PCR amplicons with terminal homology of ∼200bp to adjacent amplicons. Conservation to the mouse genome is depicted using the multiz track from the UCSC genome browser. (B) Schematic depicting the assembly workflow for the 134kb SynHoxA assemblon. BACs containing Rat HoxA were used as PCR template to generate 28 segments tiling the entire HoxA locus. These segments were co-transformed into yeast with appropriate linkers and assembly vector to build two ∼65kb half assemblons into centromeric yeast-bacteria shuttle vectors. These half assemblons are recovered to bacteria and amplified. Full 134kb assemblon was built from half assemblons after releasing them from the vector using terminal restriction enzymes ( AsiSI ) and transforming into yeast. Full assemblon was then recovered from yeast into bacteria for amplification and verification. (C) Agarose gel of the 28 PCR amplicons that tile the 134kb SynHoxA assemblon. (D) Strategy to PCR-screen yeast colonies derived from assembly experiments. Primers (red arrows) span assembly junctions and test presence/absence of amplicons in many yeast colonies. Reproduced from ref with permission from authors. (E) Agarose gel showing one yeast colony carrying the full 134kb SynHoxA assemblon verified manually for the presence of all assembly junctions, using the strategy outlined in panel D. (F) Half and Full 134kb SynHoxA assemblon BACs purified from E.coli were digested with PvuI and separated using field inversion gel electrophoresis (FIGE). Lambda monocut ladder sizes are indicated in kb. Band sizes correspond to expected fragments.

Article Snippet: 500 ng of lambda monocut ladder (New England Biolabs N3019S) were used as a molecular weight standard.

Techniques: Sequencing, Transformation Assay, Plasmid Preparation, Amplification, Agarose Gel Electrophoresis, Derivative Assay, Purification, Nucleic Acid Electrophoresis

(A) Layout of rat HoxA locus from the rn6 genome assembly depicting genes, Rn HoxA cluster segments in black and previously identified distal enhancers in purple. The Enhancers+SynHoxA assemblon sequence is made by stringing all the enhancers directly upstream of the SynHoxA assemblon sequence. Conservation to mouse genome is depicted using multiz track from the UCSC genome browser. (B) PCR amplicons tiling enhancer sequences were generated from Rat HoxA BACs and co-transformed into a yeast strain containing the 134kb SynHoxA assemblon with a gRNA vector targeting the left terminus of the 134kb assemblon. The enhancer PCR amplicons were used to repair this break, resulting in the construction of the 170kb Enhancers+SynHoxA assemblon. Assemblon was recovered into bacteria for amplification and verification. (C) Agarose gel of the 8 PCR amplicons containing enhancer sequences. (D) Agarose gel showing one yeast colony tested for the presence of novel enhancer assembly junctions and with primers spanning 134kb SynHoxA . (E) 134kb and 170kb assemblon BACs purified from E.coli were digested with PvuI and separated using FIGE. Lambda monocut ladder sizes are indicated in kb. Band sizes correspond to expected fragments.

Journal: bioRxiv

Article Title: Synthetic genomic reconstitution reveals principles of mammalian Hox cluster regulation

doi: 10.1101/2021.07.07.451065

Figure Lengend Snippet: (A) Layout of rat HoxA locus from the rn6 genome assembly depicting genes, Rn HoxA cluster segments in black and previously identified distal enhancers in purple. The Enhancers+SynHoxA assemblon sequence is made by stringing all the enhancers directly upstream of the SynHoxA assemblon sequence. Conservation to mouse genome is depicted using multiz track from the UCSC genome browser. (B) PCR amplicons tiling enhancer sequences were generated from Rat HoxA BACs and co-transformed into a yeast strain containing the 134kb SynHoxA assemblon with a gRNA vector targeting the left terminus of the 134kb assemblon. The enhancer PCR amplicons were used to repair this break, resulting in the construction of the 170kb Enhancers+SynHoxA assemblon. Assemblon was recovered into bacteria for amplification and verification. (C) Agarose gel of the 8 PCR amplicons containing enhancer sequences. (D) Agarose gel showing one yeast colony tested for the presence of novel enhancer assembly junctions and with primers spanning 134kb SynHoxA . (E) 134kb and 170kb assemblon BACs purified from E.coli were digested with PvuI and separated using FIGE. Lambda monocut ladder sizes are indicated in kb. Band sizes correspond to expected fragments.

Article Snippet: 500 ng of lambda monocut ladder (New England Biolabs N3019S) were used as a molecular weight standard.

Techniques: Sequencing, Generated, Transformation Assay, Plasmid Preparation, Amplification, Agarose Gel Electrophoresis, Purification

(A) Schematic of assembly strategy for 130kb RAREΔ SynHoxA and 166kb Enhancers + RAREΔ SynHoxA . Nature of the RARE mutations is shown on the right. RAR binding data comes from previously published reports. (see Methods) (B) Sanger sequencing traces confirmed precise CRISPR editing of RAREs in yeast. (C) SynHoxA assemblon BACs purified from E.coli were digested with PvuI and separated using FIGE. Lambda monocut ladder sizes are indicated in kb. Bands correspond to expected fragment lengths. (D) Sequencing data of assemblon BACs purified from E. coli aligned to a custom mm10 reference genome. Positions of the enhancers and protein coding genes are shown in black.

Journal: bioRxiv

Article Title: Synthetic genomic reconstitution reveals principles of mammalian Hox cluster regulation

doi: 10.1101/2021.07.07.451065

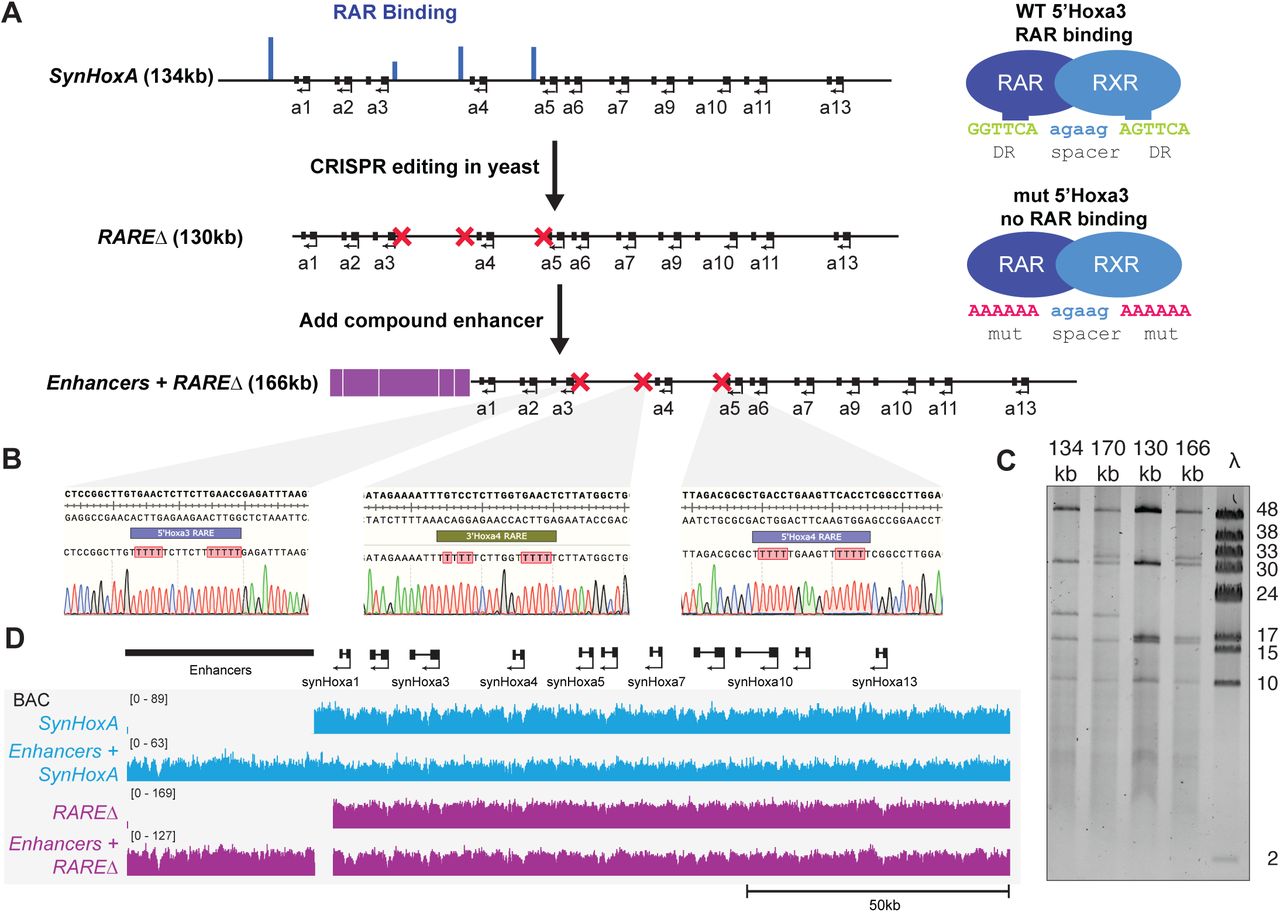
Figure Lengend Snippet: (A) Schematic of assembly strategy for 130kb RAREΔ SynHoxA and 166kb Enhancers + RAREΔ SynHoxA . Nature of the RARE mutations is shown on the right. RAR binding data comes from previously published reports. (see Methods) (B) Sanger sequencing traces confirmed precise CRISPR editing of RAREs in yeast. (C) SynHoxA assemblon BACs purified from E.coli were digested with PvuI and separated using FIGE. Lambda monocut ladder sizes are indicated in kb. Bands correspond to expected fragment lengths. (D) Sequencing data of assemblon BACs purified from E. coli aligned to a custom mm10 reference genome. Positions of the enhancers and protein coding genes are shown in black.

Article Snippet: 500 ng of lambda monocut ladder (New England Biolabs N3019S) were used as a molecular weight standard.

Techniques: Binding Assay, Sequencing, CRISPR, Purification

Restriction patterns from AseI digests of M. avium isolates resolved by PFGE. Lanes: 1 and 6, bacteriophage lambda DNA concatemers (sizes [in kilobases] are indicated on the left); 2, isolate 100A8; 3 and 4, pattern P7 (isolates 100A28 and 100A32, respectively); 5, isolate 100A25; 7 to 11, five sequential isolates from one patient, respectively (pattern P1); 12 to 15, four isolates from two patients, respectively (pattern P2).

Journal:

Article Title: Molecular Analysis of Mycobacterium avium Isolates by Using Pulsed-Field Gel Electrophoresis and PCR

doi:

Figure Lengend Snippet: Restriction patterns from AseI digests of M. avium isolates resolved by PFGE. Lanes: 1 and 6, bacteriophage lambda DNA concatemers (sizes [in kilobases] are indicated on the left); 2, isolate 100A8; 3 and 4, pattern P7 (isolates 100A28 and 100A32, respectively); 5, isolate 100A25; 7 to 11, five sequential isolates from one patient, respectively (pattern P1); 12 to 15, four isolates from two patients, respectively (pattern P2).

Article Snippet: Lanes 6 and 18, bacteriophage lambda DNA- Bst EII digest; lane 12, pBR322 DNA- Msp I digest (New England Biolabs); lanes 1 to 5, five sequential isolates from one patient, respectively (PCR profile A, PFGE pattern P1); lanes 7, 8, and 9, three sequential isolates from one patient, respectively (PCR profile A, PFGE pattern P2) (no amplification product was detected in lane 8 in that experiment); lane 10, isolate 100A31 from another patient (PCR profile A, PFGE pattern P2); lanes 11 and 13, two sequential isolates from one patient, respectively; lane 14, isolate 100A7 from a different patient (PCR profile E, PFGE pattern P6 or a unique pattern); lanes 15, 16, and 17, isolates 100A13, 100A26, and 100A30, respectively.

Techniques: Lambda DNA Preparation

PCR typing of clinical M. avium isolates. Lanes: 1 to 5, 7 to 11, and 13 to 17, patterns of isolates obtained from 15 unrelated patients; lanes 6 and 18, bacteriophage lambda DNA-BstEII digest molecular weight marker; and lane 12, pBR322 DNA-MspI digest (New England Biolabs).

Journal:

Article Title: Molecular Analysis of Mycobacterium avium Isolates by Using Pulsed-Field Gel Electrophoresis and PCR

doi:

Figure Lengend Snippet: PCR typing of clinical M. avium isolates. Lanes: 1 to 5, 7 to 11, and 13 to 17, patterns of isolates obtained from 15 unrelated patients; lanes 6 and 18, bacteriophage lambda DNA-BstEII digest molecular weight marker; and lane 12, pBR322 DNA-MspI digest (New England Biolabs).

Article Snippet: Lanes 6 and 18, bacteriophage lambda DNA- Bst EII digest; lane 12, pBR322 DNA- Msp I digest (New England Biolabs); lanes 1 to 5, five sequential isolates from one patient, respectively (PCR profile A, PFGE pattern P1); lanes 7, 8, and 9, three sequential isolates from one patient, respectively (PCR profile A, PFGE pattern P2) (no amplification product was detected in lane 8 in that experiment); lane 10, isolate 100A31 from another patient (PCR profile A, PFGE pattern P2); lanes 11 and 13, two sequential isolates from one patient, respectively; lane 14, isolate 100A7 from a different patient (PCR profile E, PFGE pattern P6 or a unique pattern); lanes 15, 16, and 17, isolates 100A13, 100A26, and 100A30, respectively.

Techniques: Lambda DNA Preparation, Molecular Weight, Marker

Electrophoretic PCR patterns for M. avium isolates. Lanes 6 and 18, bacteriophage lambda DNA-BstEII digest; lane 12, pBR322 DNA-MspI digest (New England Biolabs); lanes 1 to 5, five sequential isolates from one patient, respectively (PCR profile A, PFGE pattern P1); lanes 7, 8, and 9, three sequential isolates from one patient, respectively (PCR profile A, PFGE pattern P2) (no amplification product was detected in lane 8 in that experiment); lane 10, isolate 100A31 from another patient (PCR profile A, PFGE pattern P2); lanes 11 and 13, two sequential isolates from one patient, respectively; lane 14, isolate 100A7 from a different patient (PCR profile E, PFGE pattern P6 or a unique pattern); lanes 15, 16, and 17, isolates 100A13, 100A26, and 100A30, respectively.

Journal:

Article Title: Molecular Analysis of Mycobacterium avium Isolates by Using Pulsed-Field Gel Electrophoresis and PCR

doi:

Figure Lengend Snippet: Electrophoretic PCR patterns for M. avium isolates. Lanes 6 and 18, bacteriophage lambda DNA-BstEII digest; lane 12, pBR322 DNA-MspI digest (New England Biolabs); lanes 1 to 5, five sequential isolates from one patient, respectively (PCR profile A, PFGE pattern P1); lanes 7, 8, and 9, three sequential isolates from one patient, respectively (PCR profile A, PFGE pattern P2) (no amplification product was detected in lane 8 in that experiment); lane 10, isolate 100A31 from another patient (PCR profile A, PFGE pattern P2); lanes 11 and 13, two sequential isolates from one patient, respectively; lane 14, isolate 100A7 from a different patient (PCR profile E, PFGE pattern P6 or a unique pattern); lanes 15, 16, and 17, isolates 100A13, 100A26, and 100A30, respectively.

Article Snippet: Lanes 6 and 18, bacteriophage lambda DNA- Bst EII digest; lane 12, pBR322 DNA- Msp I digest (New England Biolabs); lanes 1 to 5, five sequential isolates from one patient, respectively (PCR profile A, PFGE pattern P1); lanes 7, 8, and 9, three sequential isolates from one patient, respectively (PCR profile A, PFGE pattern P2) (no amplification product was detected in lane 8 in that experiment); lane 10, isolate 100A31 from another patient (PCR profile A, PFGE pattern P2); lanes 11 and 13, two sequential isolates from one patient, respectively; lane 14, isolate 100A7 from a different patient (PCR profile E, PFGE pattern P6 or a unique pattern); lanes 15, 16, and 17, isolates 100A13, 100A26, and 100A30, respectively.

Techniques: Lambda DNA Preparation, Amplification